Michigan Population Map
Click or tap the map to enlarge it.
Michigan Population Map – Key Takeaways
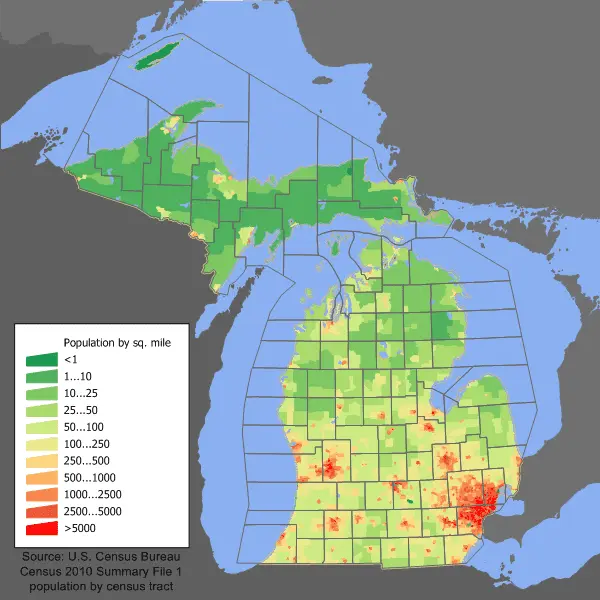
- Michigan Population Map provides valuable insights into the population distribution across various regions of Michigan.
- This map offers a visual representation of population density in different counties.
- The population data can help policymakers, researchers, and businesses make informed decisions concerning resource allocation, infrastructure development, and market strategies.
- Understanding population distribution is essential for planning educational institutions, healthcare facilities, and public services.
- Michigan Population Map serves as a useful tool for demographic analysis and trend identification.
A Brief History
Michigan, one of the fifty states in the United States, is located in the Great Lakes region. It became the 26th state to join the Union on January 26, 1837. Michigan has a rich history shaped by Native American tribes, European exploration, and subsequent settlement. Over time, the state experienced significant population growth due to various factors such as the availability of natural resources, industrial development, and immigration.
Unique Insights
The Michigan Population Map provides several unique insights into the state’s demographics. These insights include:
- Population Density: The map showcases areas with high population density, such as urban regions like Detroit, Ann Arbor, and Grand Rapids.
- Rural Areas: The map also highlights less densely populated rural areas, particularly in the northern parts of the state, indicating a more dispersed population distribution.
- Trends and Changes: By comparing population maps from different years, one can observe population shifts, growth patterns, and the impact of various economic factors on different regions of Michigan.
- Regional Disparities: The map reveals disparities in population distribution between urban and rural areas, as well as differences in population density among different counties.
- Economic Centers: The map shows the concentration of population in areas with significant economic activities, such as manufacturing hubs and university towns.
Table of Relevant Facts
| Year | Population | Growth Rate |
|---|---|---|
| 1950 | 7,891,872 | 27.6% |
| 1960 | 8,881,826 | 13.3% |
| 1970 | 9,262,078 | 4.3% |
| 1980 | 9,262,078 | 0.0% |
| 1990 | 9,295,297 | 0.4% |
| 2000 | 9,938,444 | 6.9% |
| 2010 | 9,883,640 | -0.6% |
| 2020 | 10,077,331 | 1.9% |
Frequently Asked Questions (FAQ)
1. How is population density calculated?
Population density is calculated by dividing the total population of an area by its land area in square kilometers or square miles.
2. What are the most populous counties in Michigan?
The most populous counties in Michigan include Wayne County, Oakland County, and Macomb County.
3. How has the population of Michigan changed over time?
The population of Michigan has shown fluctuation over time, experiencing periods of growth and decline due to various economic and social factors.
4. Which areas of Michigan have the highest population growth rates?
Urban areas and counties with major economic centers generally experience higher population growth rates compared to rural areas.
5. How does the population distribution affect resource allocation in Michigan?
The population distribution influences resource allocation in terms of education, healthcare, infrastructure development, and other public services. Areas with higher population concentrations require more resources to meet the demands of their residents.
6. What are some key considerations for policymakers based on the Michigan Population Map?
Policymakers can utilize the map to identify regions with unique population needs, plan urban development, promote balanced economic growth, and address disparities in resource allocation.
7. How can businesses benefit from the Michigan Population Map?
Businesses can leverage the map to identify potential market opportunities, understand consumer demographics, and make informed decisions about market entry and expansion.